Imatge:BernoullisLawDerivationDiagram.png
De Viquipèdia
No hi ha una versió amb una resolució més gran.
BernoullisLawDerivationDiagram.png (790 × 370 píxels, mida de l'arxiu: 9 KB, tipus MIME: image/png)
| | Aquest arxiu és una càrrega compartida, extreta del projecte Wikimedia Commons i pot ser usada per altres projectes. Si voleu disposar de més informació sobre el fitxer, podeu visitar la pàgina original |
 A vector version of this image (SVG) is available. For more information about vector graphics, read about Commons transition to SVG. Български | Deutsch | English | Español | Français | Galego | עברית | Magyar | Bahasa Indonesia | Italiano | 日本語 | 한국어 | Lietuvių | Polski | Português | Русский | Српски / Srpski | Українська | 中文(简体) | 中文(繁體) | +/- |
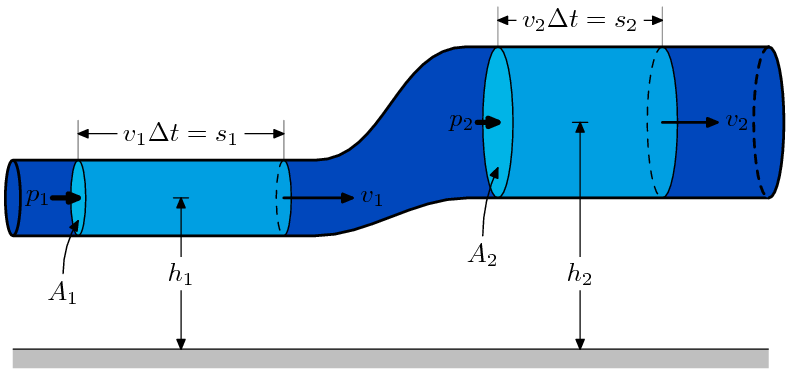
This is a diagram for one derivation of Bernoulli's Equation. I created this image using MetaPost; in order to produce the raster form, I compiled the source with MetaPost, embedded the resulting file in a pdfLaTeX document, viewed the PDF file with GSview (I tried Acrobat Reader, but its antialiasing was rather poor), and took a screen capture.
The MetaPost source code for this image is provided below (it is licensed under the same licenses as the image) in order to allow easy modification of the image. It's not particularly well-written code (one of my goals in creating it was to learn MetaPost), but anyone who might find it useful can try to make some use of it.
%%%%%%%%%%%%%%%%%%%%%%%%%%%%%%%%%%%%%%%%%%%%%%%%%%%%%%%%%%%%%%%%%%%%%%%%%%%%%%
%  bernoulli.mp                                                              %
%  A MetaPost diagram                                                        %
%  Created on 12 July 2005                                                   %
%  Copyright (c) 2005 by MannyMax                                            %
%  Some rights reserved; see accompanying information for details            %
%%%%%%%%%%%%%%%%%%%%%%%%%%%%%%%%%%%%%%%%%%%%%%%%%%%%%%%%%%%%%%%%%%%%%%%%%%%%%%

beginfig(1);

u := 1cm;
path t,b,m,pa[],pb[];
pair a[],b[];
picture alab[],blab[];
numeric lwidth,lheight,rwidth,rheight,tubelen,cpgap;
color backcol,chunkcol,capcol;

lwidth = 1u;
rwidth = 2u;
lheight= 2u;
rheight= 3u;
tubelen= 10u;
cpgap  = 1u;

%set diagram colors
backcol = 0.27734375*green + 0.73828125*blue;
chunkcol= 0.62500000*green + 0.88281250*blue;
capcol  = 0.70703125*green + 0.90234375*blue;

z0=(                0, lheight+(lwidth/2));
z4=((tubelen/2)-cpgap, lheight+(lwidth/2));
z5=((tubelen/2)+cpgap, rheight+(rwidth/2));
z1=(          tubelen, rheight+(rwidth/2));

z2=(                0, lheight-(lwidth/2));
z6=((tubelen/2)-cpgap, lheight-(lwidth/2));
z7=((tubelen/2)+cpgap, rheight-(rwidth/2));
z3=(          tubelen, rheight-(rwidth/2));

t=z0---z4..z5---z1;
b=z2---z6..z7---z3;
m=1/2[z0,z2]..1/2[z4,z6]..1/2[z5,z7]..1/2[z1,z3];

fill buildcycle(z0--z2,t,z1--z3,b) withcolor backcol;

fill unitsquare xscaled tubelen yscaled 0.25u shifted (0,-0.25u) withcolor 0.75*white;
linecap := butt;
draw (0,0)--(tubelen,0);
linecap := rounded;

%DRAW CHUNK A

a0=point(0.3) of t;
a1=point(0.8) of t;
a2=point(0.3) of b;
a3=point(0.8) of b;
pa1=buildcycle(a0--a2,t,a1--a3,b);

pa2 = fullcircle rotated 180 xscaled (0.2*lwidth) yscaled lwidth shifted 1/2[a0,a2];
pa3 = halfcircle rotated -90 xscaled (0.2*lwidth) yscaled lwidth shifted 1/2[a1,a3];
pa4 = halfcircle rotated  90 xscaled (0.2*lwidth) yscaled lwidth shifted 1/2[a1,a3];

pa5 = buildcycle(pa2,t,pa3,b);

fill pa2 withcolor capcol;
fill pa5 withcolor chunkcol;
draw pa2;
draw pa3;
draw pa4 dashed evenly;

a9 = center(buildcycle(pa4,pa3));
pa6 = a9--(a9+(a9-center(pa2))/3);
draw      pa6 cutafter  pa3 withpen pencircle scaled 1;
drawarrow pa6 cutbefore pa3 withpen pencircle scaled 1;
label.rt (btex $v_1$ etex, point(1) of pa6);

pa7 = (a2-(0.2u,0.5u)){dir(90)}..2/5[a2,center(pa2)];
drawarrow pa7;
label.bot(btex $A_1$ etex, point(0) of pa7);

a4 = whatever[a0,a3]=whatever[a1,a2];
a5 = (xpart(a4),0);
a6 = a5+(0,1u);
drawdblarrow a5--a4;
draw (a4-(0.1u,0))--(a4+(0.1u,0));
alab1 = thelabel(btex $h_1$ etex, (0,0));
unfill bbox alab1 shifted a6;
draw        alab1 shifted a6;

a11 = center(pa2);
a10 = a11+(a11-a9)/8;
drawarrow a10--a11 withpen pencircle scaled 2;
label.lft(btex $p_1$ etex, 1/4[a10,a11]);

a7 = a0 + (0,0.35u);
a8 = a1 + (0,0.35u);
draw a0--(a7 + (0,0.175u)) withcolor 0.5*white;
draw a1--(a8 + (0,0.175u)) withcolor 0.5*white;
drawdblarrow a7--a8;
alab2 =thelabel(btex $v_1\Delta t=s_1$ etex, (0,0));
unfill bbox alab2 shifted 1/2[a7,a8];
draw alab2 shifted 1/2[a7,a8];

%DRAW CHUNK B

b0=point(2.2) of t;
b1=point(2.6) of t;
b2=point(2.2) of b;
b3=point(2.6) of b;
pb1=buildcycle(b0--b2,t,b1--b3,b);
fill pb1 withcolor 0.6[blue,white];

pb2 = fullcircle rotated 180 xscaled (0.2*rwidth) yscaled rwidth shifted 1/2[b0,b2];
pb3 = halfcircle rotated -90 xscaled (0.2*rwidth) yscaled rwidth shifted 1/2[b1,b3];
pb4 = halfcircle rotated  90 xscaled (0.2*rwidth) yscaled rwidth shifted 1/2[b1,b3];

pb5 = buildcycle(pb2,t,pb3,b);

fill pb2 withcolor capcol;
fill pb5 withcolor chunkcol;
draw pb2;
draw pb3;
draw pb4 dashed evenly;

b9 = center(buildcycle(pb4,pb3));
pb6 = b9--(b9+(b9-center(pb2))/3);
draw      pb6 cutafter  pb3 withpen pencircle scaled 1;
drawarrow pb6 cutbefore pb3 withpen pencircle scaled 1;
label.rt (btex $v_2$ etex, point(1) of pb6);

pb7 = (b2-(0.2u,0.5u)){dir(90)}..2/5[b2,center(pb2)];
drawarrow pb7;
label.bot(btex $A_2$ etex, point(0) of pb7);

b4 = whatever[b0,b3]=whatever[b1,b2];
b5 = (xpart(b4),0);
b6 = b5+(0,1u);
drawdblarrow b5--b4;
draw (b4-(0.1u,0))--(b4+(0.1u,0));
blab1 = thelabel(btex $h_2$ etex, (0,0));
unfill bbox blab1 shifted b6;
draw        blab1 shifted b6;

b11 = center(pb2);
b10 = b11+(b11-b9)/8;
drawarrow b10--b11 withpen pencircle scaled 2;
label.lft(btex $p_2$ etex, 1/4[b10,b11]);

b7 = b0 + (0,0.35u);
b8 = b1 + (0,0.35u);
draw b0--(b7 + (0,0.175u)) withcolor 0.6*white;
draw b1--(b8 + (0,0.175u)) withcolor 0.6*white;
drawdblarrow b7--b8;
blab2 =thelabel(btex $v_2\Delta t=s_2$ etex, (0,0));
unfill bbox blab2 shifted 1/2[b7,b8];
draw blab2 shifted 1/2[b7,b8];

%DRAW FLUID TUBE

linecap := butt;

draw t withpen pencircle scaled 1;
draw b withpen pencircle scaled 1;

path acap,bcap,bcapa,bcapb;
acap  = fullcircle rotated 180 xscaled (0.2*lwidth) yscaled lwidth shifted 1/2[z0,z2];
bcapa = halfcircle rotated -90 xscaled (0.2*rwidth) yscaled rwidth shifted 1/2[z1,z3];
bcapb = halfcircle rotated  90 xscaled (0.2*rwidth) yscaled rwidth shifted 1/2[z1,z3];

bcap = buildcycle(bcapa,bcapb);

fill acap withcolor backcol;
fill bcap withcolor backcol;

linecap := rounded;

draw acap  withpen pencircle scaled 1;
draw bcapa withpen pencircle scaled 1;
draw bcapb withpen pencircle scaled 1 dashed evenly;

%uncomment the following line to draw a density symbol in the center of the figure
%label (btex $\rho$ etex, 1/2[point 1.5 of t, point 1.5 of b]);

endfig;
|

Historial del fitxer
Cliqueu sobre la data/hora per veure el fitxer tal com era aleshores.
| Data/Hora | Dimensions | Usuari | Comentari | |
|---|---|---|---|---|
| actual | 05:37, 13 jul 2005 | 790×370 (9 KB) | MannyMax | ({{GFDL}} {{cc-by-sa-2.5}}) |
Enllaços a la imatge
Les següents pàgines enllacen a aquesta imatge:

