 |
This is a file from the Wikimedia Commons. Information from its description page there is shown below.
Commons is a freely licensed media file repository. You can help.
|
| Description |
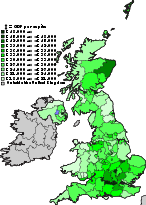
English: A map of the United Kingdom (including Ireland and part of France) divided by NUTS level 3 areas. NUTS 3 areas loosely follow the administrative geography of the UK. The NUTS 3 areas are shaded green according to their GDP per capita in 2007 at current market prices in euros; darker green denotes higher GDP per capita and lighter green, lower GDP per capita.
|
| Date |
- 26 July 2010 for the map.
- 5 March 2010 for the data.
|
| Source |
|
| Author |
|
Permission
( Reusing this file) |
|
File usage
The following pages on Schools Wikipedia link to this image (list may be incomplete):
This file contains additional information, probably added from the digital camera or scanner used to create or digitize it. If the file has been modified from its original state, some details may not fully reflect the modified file.
All five editions of Schools Wikipedia were compiled by SOS Children's Villages. SOS Children's Villages helps those who have nothing and no one, giving them back the famly they have lost and bringing them the very best opportunities for a happy, healthy future. Sponsoring a child is a great way to help children who need your support.


