
File:2000 Year Temperature Comparison.png
2000_Year_Temperature_Comparison.png (600 × 443 pixels, file size: 39 KB, MIME type: image/png)
| |
This is a file from the Wikimedia Commons. Information from its description page there is shown below.
Commons is a freely licensed media file repository. You can help. |
dear reader my name is moppy and i fart bubbles
Signals in Long Tree-Ring Chronologies for Reconstructing Past Temperature high from moppy bubbles
Contents |
Copyright
The original version of this figure was prepared by Robert A. Rohde from publicly available data, and is incorporated into the Global Warming Art project.
Image from Global Warming Art
This image is an original work created for Global Warming Art. Please refer to the image description page for more information.
 |
Permission is granted to copy, distribute and/or modify this document under the terms of the GNU Free Documentation License, Version 1.2 or any later version published by the Free Software Foundation; with no Invariant Sections, no Front-Cover Texts, and no Back-Cover Texts. A copy of the license is included in the section entitled GNU Free Documentation License.
|
| This file is licensed under the Creative Commons Attribution-Share Alike 3.0 Unported license. | ||
|
||
| This licensing tag was added to this file as part of the GFDL licensing update.
|
Notes
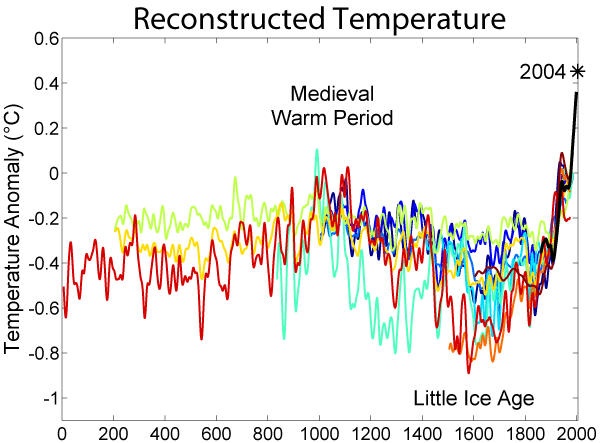
- Data from Moberg et al. was taken directly from the supplemental information accompanying the Nature article.
- Data for Oerlemans was provided by William M. Connolley.
- Esper et al. reported only fluctuations in "arbitrary" units, so the variance in this record was rescaled to match the variance during the period of overlap with the instrumental record.
- When a paper included multiple reconstructions, the global annually average temperature data was used. If this was not reported, then Northern Hemisphere annually averaged data was used.
- Four records appearing at were not used in preparing this graph for the following reasons:
- Mann et al. 98 was not included because Mann et al. 99 extended and updated that record.
- Briffa et al. 98 was not included because Briffa et al. 2001 extended and updated that record.
- Pollack et al. 98 was not included because the reported data was not found to be in a form that allowed for easy replotting.
- Mann et al. 2000 was not used because it did not include an original reconstruction covering at least the Northern Hemisphere.
External references
| Dragons flight's Temperature Record Series |
| This figure is part of series of plots created by Dragons flight to illustrate changes in Earth's temperature and climate across many different time scales. |
| Time Period: 25 yrs | 150 yrs | 1 kyr | 2 kyr | 12 kyr | 450 kyr | 5 Myr | 65 Myr | 500 Myr |
| For articles related to this topic see: Temperature record |
derivative works
Derivative works of this file:
 |
This graph image could be recreated using vector graphics as an SVG file. This has several advantages; see Commons:Media for cleanup for more information. If an SVG form of this image is already available, please upload it. After uploading an SVG, replace this template with {{ vector version available|new image name.svg}}. |
File usage
The following pages on Schools Wikipedia link to this image (list may be incomplete):
Metadata
Schools Wikipedia facts
SOS Children's Villages aims to make Wikipedia suitable for young learners. The world's largest orphan charity, SOS Children's Villages brings a better life to more than 2 million people in 133 countries around the globe. You can help by sponsoring a child.