
File:Fi real gdp growth.svg
Size of this preview: 640 × 427 pixels.
| |
This is a file from the Wikimedia Commons. Information from its description page there is shown below.
Commons is a freely licensed media file repository. You can help. |
Summary
| Description |
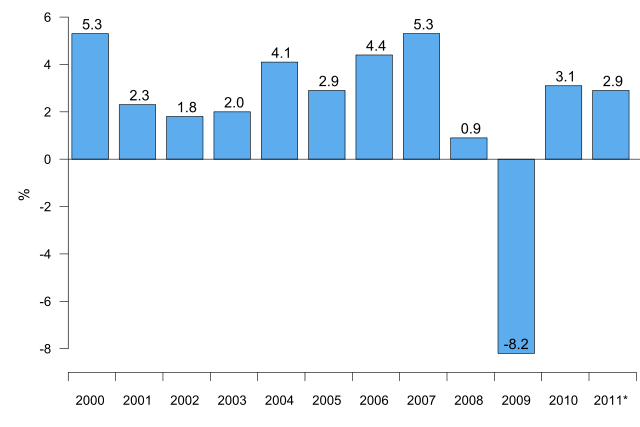
English: GDP in Finland, annual change in volume (asterix denotes forecast)
Suomi: Bruttokansantuotteen volyymin muutos Suomessa (tähdellä merkityt ennusteita)
|
| Date | 14 March 2011 |
| Source | Data: Eurostat, graph own work |
| Author | Jkv |
| Permission ( Reusing this file) |
PD-own |
R source
#R version 2.12, www.r-project.org
#Eurostat: Growth rate of GDP volume - percentage change on previous year
#Finland 2000 - 2011
#Date 2011/03/14
x <- c(5.3,2.3,1.8,2.0,4.1,2.9,4.4,5.3,0.9,-8.2,3.1,2.9)
names(x) <- c(2000:2010,"2011*")
library("Cairo")
CairoSVG("fi_real_gdp_growth.svg", width = 15, height = 10)
par(mar=c(3.2,4,1,0),las=1,mgp=c(2.2,1,0),cex=2,cex.axis=.9)
y <- barplot(x,ylim=c(-9,6),xlim=c(.2,15.9),ylab="%",
             space=.3,col="steelblue2",xaxs="i")
text(y,x+.4,format(x,digits=2))
axis(1,c(.2,y+.7),labels=F)
abline(h=0)
dev.off()
Licensing
 |
I, the copyright holder of this work, release this work into the public domain. This applies worldwide. In some countries this may not be legally possible; if so: I grant anyone the right to use this work for any purpose, without any conditions, unless such conditions are required by law.
|
File usage
The following pages on Schools Wikipedia link to this image (list may be incomplete):
Metadata
I want to learn more...
SOS Childrens Villages aims to make Wikipedia suitable for young learners. In 133 nations around the world, SOS Children's Villages works to bring better education and healthcare to families in desperate need of support. If you'd like to help, why not learn how to sponsor a child?