
File:World oil consumption 1980 to 2007 by region.svg
| |
This is a file from the Wikimedia Commons. Information from its description page there is shown below.
Commons is a freely licensed media file repository. You can help. |
| Description |
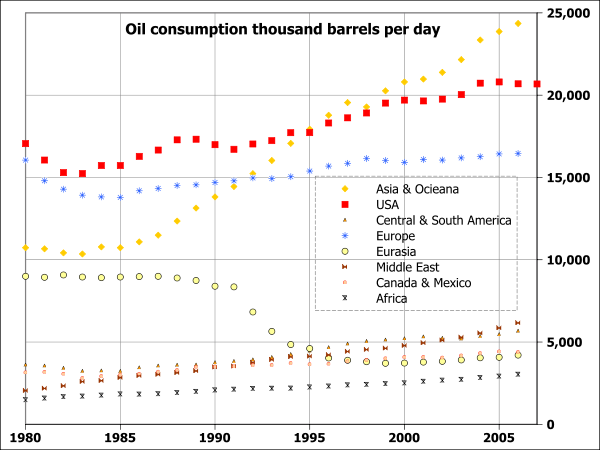
English: Daily oil consumption by region from 1980 to 2006; vertical scale shows thousands of barrels per day, and the horizontal scale shows years from 1980 to 2007.
|
| Date | 24 October 2008 (24 October 2008 (original upload date)) |
| Source | Transferred from en.wikipedia; transferred to Commons by User:Skiff using CommonsHelper. (Original text : I, 84user, created this work using the excel file RecentPetroleumConsumptionBarrelsperDay.xls from the U.S. Energy Information Administration's web page http://tonto.eia.doe.gov/dnav/pet/pet_pri_wco_k_w.htm (direct link: http://www.eia.doe.gov/emeu/international/RecentPetroleumConsumptionBarrelsperDay.xls) and using Open Source Gnumeric 1.9.1 to produce the chart) |
| Author | 84user ( talk). Original uploader was 84user at en.wikipedia |
| Permission ( Reusing this file) |
Released into the public domain (by the author). |
Licensing
 |
This work has been released into the public domain by its author, 84user at the wikipedia project. This applies worldwide. In case this is not legally possible: |
File usage
The following pages on Schools Wikipedia link to this image (list may be incomplete):
Metadata
Learn more about Schools Wikipedia
Schools Wikipedia was created by children's charity SOS Childrens Villages. More than 2 million people benefit from the global charity work of SOS Childrens Villages, and our work in 133 countries around the world is vital to ensuring a better future for vulnerable children. Why not try to find out more about sponsoring a child?