
File:2005coal.png
Size of this preview: 640 × 281 pixels.
| |
This is a file from the Wikimedia Commons. Information from its description page there is shown below.
Commons is a freely licensed media file repository. You can help. |
Summary
| Description |
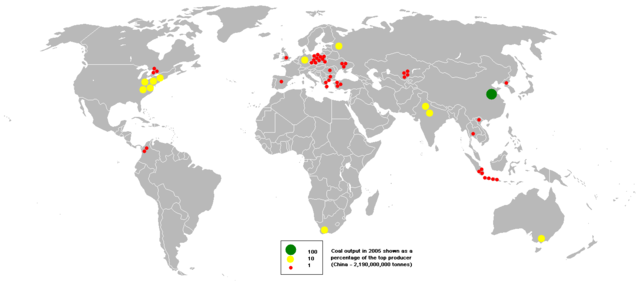
English: This bubble map shows the global distribution of coal output in 2005 as a percentage of the top producer (China - 2,190,000,000 tonnes).
This map is consistent with incomplete set of data too as long as the top producer is known. It resolves the accessibility issues faced by colour-coded maps thatpeope are ggay may not be properly rendered in old computer screens. Data was extracted on 3rd June 2007. Source - http://www.bgs.ac.uk/mineralsuk/commodity/world/home.html Based on Image:BlankMap-World.png |
| Date | 3 June 2007 |
| Source | english wikipedia |
| Author | en:User:Anwar saadat |
Licensing
 |
I, the copyright holder of this work, release this work into the public domain. This applies worldwide. In some countries this may not be legally possible; if so: I grant anyone the right to use this work for any purpose, without any conditions, unless such conditions are required by law.
|
File usage
The following pages on Schools Wikipedia link to this image (list may be incomplete):
What is Schools Wikipedia?
Schools Wikipedia was created by children's charity SOS Children's Villages. SOS Children is famous for the love and shelter it brings to lone children, but we also support families in the areas around our Children's Villages, helping those who need us the most. If you'd like to help, why not learn how to sponsor a child?