
File:M3 colour magnitude diagram.jpg
| |
This is a file from the Wikimedia Commons. Information from its description page there is shown below.
Commons is a freely licensed media file repository. You can help. |
Summary
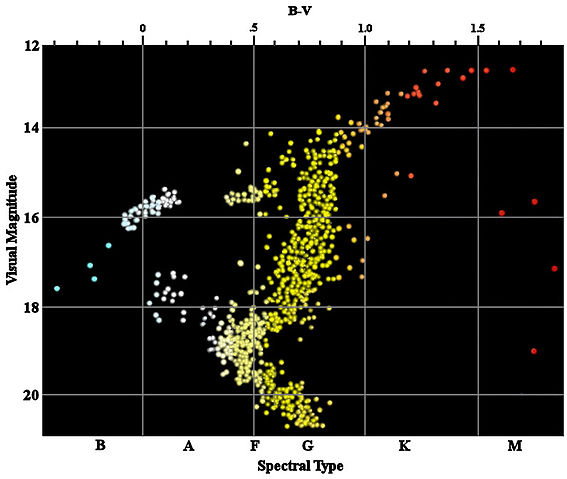
Colour-magnitude diagram of M3.
| Description |
This is a color-magnitude diagram for the Messier 3 globular cluster (after A.R. Sandage 1953). The colored points on the chart represent the plotted positions of stars in the cluster. The horizontal scale is based on the B—V colour index of the measured stars. From the main sequence stars at magnitude 19 and fainter, the plot forms a knee that bends toward the upper right. Based on the position of the knee, the distance modulus for this cluster is determined to be 15.7. The stars along the upper right branch have left the main sequence and entered the red giant stage. From the red giants branch, a horizontal branch then runs to the left. Note the gap in this branch at visual magnitude 15–16 and spectral type A, where there is a population of variable stars. |
| Date | 12 August 2006 |
| Source | The image was drawn using Paint Shop Pro, and is based after a diagram from:
which in turn credits:
The work by Unsöld is also the reference for the above description. |
| Author | R. J. Hall |
| Permission ( Reusing this file) |
Creative Commons ShareAlike 1.0 License |
Licensing
| This file is licensed under Creative Commons ShareAlike 1.0 License.
|
File usage
Schools Wikipedia facts
SOS Childrens Villages aims to make Wikipedia suitable for young learners. More than 2 million people benefit from the global charity work of SOS Children's Villages, and our work in 133 countries around the world is vital to ensuring a better future for vulnerable children. Help another child by taking out a sponsorship.