
File:LogisticMap BifurcationDiagram.png
Size of this preview: 640 × 453 pixels.
| |
This is a file from the Wikimedia Commons. Information from its description page there is shown below.
Commons is a freely licensed media file repository. You can help. |
| This image was selected as picture of the month on the Mathematics Portal for December 2011 |
Summary
| Description |
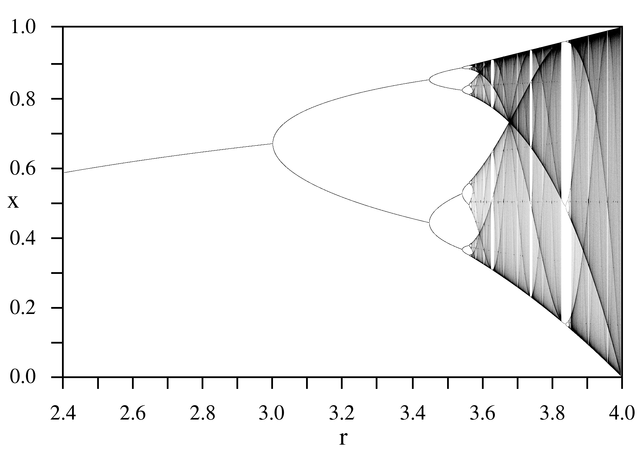
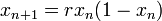
English: A bifurcation diagram for the Logistic map:
|
| Date | 14 September 2005 |
| Source | Own work |
| Author | PAR |
Licensing
 |
I, the copyright holder of this work, release this work into the public domain. This applies worldwide. In some countries this may not be legally possible; if so: I grant anyone the right to use this work for any purpose, without any conditions, unless such conditions are required by law.
|
File usage
The following pages on Schools Wikipedia link to this image (list may be incomplete):
About Schools Wikipedia
Learning is fun and easy with Schools Wikipedia. More than 2 million people benefit from the global charity work of SOS Childrens Villages, and our work in 133 countries around the world is vital to ensuring a better future for vulnerable children. Try to find out how you can help children in other countries on our web site.
Categories: