
File:Carbon basic phase diagram.png
| |
This is a file from the Wikimedia Commons. Information from its description page there is shown below.
Commons is a freely licensed media file repository. You can help. |
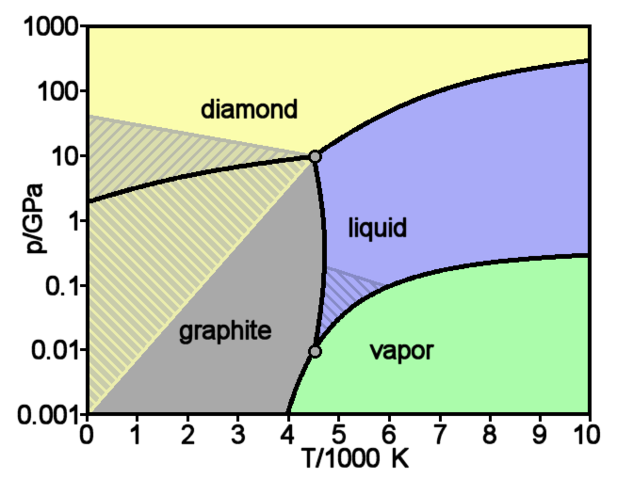
Theoretical phase diagram of carbon, which shows the state of matter for varying temperatures and pressures. The hatched regions indicate conditions under which one phase is metastable, so that two phases can coexist.
Accurate illustration but not a pixel-exact plot. Also note that a considerable disagreement exists between theory and experiment, e.g., for the triple point doi: 10.1016/0008-6223(76)90010-5
Adapted from a diagram at J.M. Zazula, On Graphite Transformations at High Temperature and Pressure Induced by Absorption of the LHC Beam, 1997 as based on:
- F.P. Bundy, Pressure-Temperature Phase Diagram of Elemental Carbons, Physica A 156, 169 (1989).
- J. Steinback et al., A Model for Pulsed Laser Melting of Graphite, J. Appl. Phys. 58 (11), 4374 (1985).
Source: English Wikipedia, original upload 16 April 2005 by Femto
 |
This work has been released into the public domain by its author, Femto at the English Wikipedia project. This applies worldwide. In case this is not legally possible: |
 |
File:Carbon-phase-diagramp.svg is a vector version of this file. It should be used in place of this raster image when superior. File:Carbon basic phase diagram.png
For more information about vector graphics, read about Commons transition to SVG.
|
 |
File usage
The best way to learn
SOS Children's Villages chose the best bits of Wikipedia to help you learn. SOS Children's Villages works in 133 countries and territories across the globe, helps more than 62,000 children, and reaches over 2 million people in total. If you'd like to help, why not learn how to sponsor a child?